|
Hey guys, it's Chef Sarah here to teach y'all how to make a lovely cherry sauce. Tastes great on chocolate torte, ice cream, and linear equations!  Here's a picture of the finished product. Yummy right? Looks like five-stars to me! All joking aside though, in this equation y1 and x1 represent a point on the line (and of course m=slope). Knowing the slope and at least one point is very useful, because then you can graph it. This formula could save lives with our Desmos project! But Chef, I hear you saying, what if I don't like cherry sauce and I'd rather have it in a y=mx+(#) format? Well don't worry, because all the ingredients in this recipe can also be used in a y=mx+(#) pie if you use Algebra! Just remember BEDMAS and you'll have a tasty pie in no time. Of course, we have a video to explain it in non-culinary terms down below. We also did a worksheet to help us practice making y=mx+(#) pie. It was a Schwab worksheet with one of those bad jokes." Why didn't the circus manager want their human cannonball to quit?". The joke is terrible, so I'll tell you Campbell's far superior answer; "Because they wanted to fire him instead". That's all folks! Happy cooking! 
0 Comments
Happy Tuesday everyone! I hope all of you had an awesome day in the sun! This Karmen with your linear equations blog post. We've been looking at 'slope-intercept form', aptly named considering it's form. This equation uses the slope and y-intercept to form any straight line on the graph (hence linear). Here's the form: y= mx + b It's super big because it's super important: this is the most commonly used line equation form. We'll need to know this, not only for our desmos projects, but also for higher level maths and sciences. As always, the m represents slope, while the b represents the y-intercept. Remember the slope equation (y-y divided by x-x) is also on your formula sheet, so no memorization! This (hopefully) is Josey's awesome post on line intercepts if you need a refresher. When plotting slope-intercept equations on a graph, you should start at the intercept and build the line, using its slope. 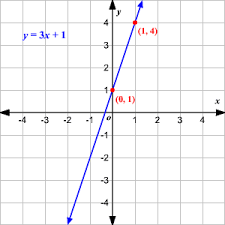 And we have a line! Whether you start with equation or graph, the concept it the same. So why? Why do we graph and stuff? It's to analyze data points, specifically (in this case) data that rises at steady increments. Naturally, the next step is word problems. I don't have any examples for those, but I'm sure if you asked Ms. Bjornson or a friendly young mathematician they'd be happy to help out. I've included videos below, as well as a little something extra.
(I just found the last one cool.) Hola chicos, it's Olaf. Hope everyone's long weekend has been going great. To recap on a few days ago, Rainbow Week was such a success! It was great to see everyone coming together in solidarity with the LGBT + community plus the treats were really good. Okay but before I get carried away, a quick shout out to our last scribe, because now we know how to graph lines by their slope and point and we learned the formula to find slope. (Rise over Run.) Here is just an easy peasy review of Perpendicular and Parallel lines and their slopes. 1) Parallel Starting off, parallel lines are two lines of a plane that never meet but are the same distance apart. Example: 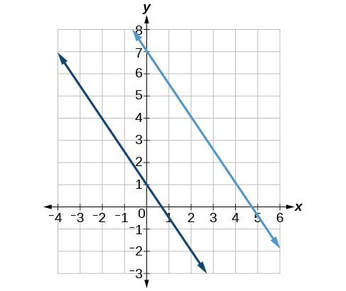 Slopes of Parallel lines have the same basis. They always have the same slope and don't intersect. These lines continue forever (∞) without touching. Slope is a measure of the angle of a line from the horizontal. We know parallel lines must have the same angle, therefore they have the same slope. This graph demonstrates this effect: 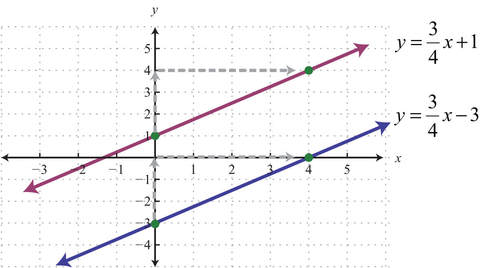 As we can see, because both lines have a slope of 3/4 and are the same distance apart, it's safe to say it's defiantly an example of a Parallel line slope. 2) Perpendicular  So what are perpendicular lines? Well to make it easy, perpendicular lines are lines that meet at right angles which are 90 degrees. It's quick to spot a difference from parallel lines because it intersects. Perpendicular lines have slopes that are negative reciprocals. An example could be: A slope: m = - 4/5 Which if it's changed to perpendicular would be: m(┴)= 5/4 Ex: a/b = -b/a Note: ┴ just represents perpendicular. * Happy Victoria Day! *
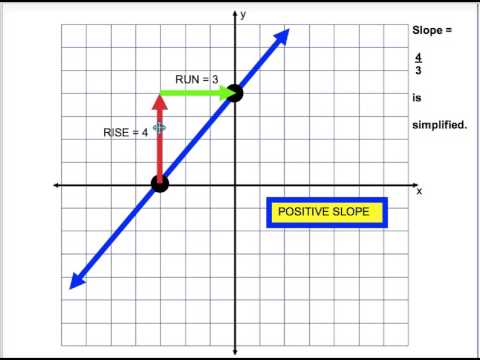
Hello it's Frida. Here's a reminder about slope. Slope is the measure of the steepness of a line. The formula for slope is rise/run. The vertical displacement is the rise, and the horizontal displacement is the run. There are two relationships in slope, the first being a direct relationship. This occurs when the rise gets bigger, causing slope to also get steeper. The second is an inverse relationship, which is when run gets bigger, causing slope to get smaller.
HOW TO GRAPH LINE WITH POINT AND SLOPE Step 1: Plot known point Step 2: From launch point rise and run according to slope Step 3: Draw a line (with a ruler) through the points making sure that the line goes to the end of the graph or ends with arrows SLOPES FOR HORIZONTAL AND VERTICAL LINES The boring way is to know that horizontal lines have a slope of 0 and vertical lines have an undefined slope (slope doesn't exist), but the fun way is called the LITTLE DUDE METHOD. If little dude can run forever, it has a slope of 0, but if little dude hits a wall, slope is undefined. 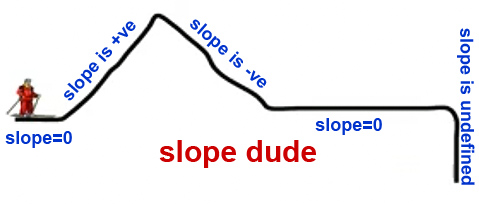
 Hi, It's Mona :) Here's a quick recap on what a function is, and how to use it. A function is a relation where each x value is related to only one y value. So y values can be related to more than one different x values, but not the other way around. One way of testing if a relation is a function or not is through the vertical line test. To do this you graph the relation and pass a vertical line over the graph. If the vertical line ever intersects the graph more than once, then it's not a function. Functions have a special notation. In function notation, you put an f(x) where you would otherwise use a y. For example, instead of writing "y = x + 6", you would write "f(x) = x + 6". When you are evaluating a function, there is an input and an output. The input is x, so wherever you see an x you can just replace it with your input. The output is whatever f(x) is equal to, once you replace all the x-es with your input. It is also equal to y.
For the second video it's more helpful after about 3:50. (But the first part is also cool :P )
Hey guys, it's Jo! Sorry for the late post, I'm really lazy. During lesson 2 we talked about x and y intercepts. and how to calculate them. When calculating an x intercept y=0 and when calculating the y intercept x=0 so you can use the formula to graph the intercepts. There can be as many intercepts as the degree of the function allows (ex: -4< x^3<7 has a maximum of 3 x intercepts.). We also did an example with a car that was bought (new) for 20,000 and calculated how the value decreased over time, by using the formula V= 20,000-1250t, V being value and t being time, with V on the y axis and t on the x axis. (for example: t (imput) = 3. 20,000 - (1250x3) = 20,000 - 3750 = 16,250 $, therefore V=16250$(output) therefore, the ordered pair is 3,16250) "You are not spat out of the womb knowing this," says Ms Bjornson, eternal fountain of wisdom. Welcome to domain and range, brought to you by Isolde. Domain and range is all about having an exclusive graph party to which only certain numbers are invited. Domain refers to all possible values of x and range to all possible values of y. To state the domain ya just write D = { all the permissible values of x } and ditto for range, R = { all permissible values of y} Curly brackets are a necessary evil. Don't ask me why. They just look cool, and we all want to look cool when we go to a party. "But what could this possibly be for??" you might ask. "Just letting the world know which x and y values are allowed on your graph." replies Ms B. "But when am I ever going to use this?" "As a barber, of course. To restrict the domain. In other words, give your line a haircut." Instead of always having arrows zooming off to infinity at the edges of graphs, this allows us to make them start and stop somewhere. Katie says restriction is the bouncer at the math party. Analogies aside. The way you state domain and range depends on whether you have a discrete or continuous graph. Check out Anastasia's fantastic post if you have no idea what that means! Inviting Numbers to the Discrete Graph Party. Selected guests, expensive caviar.
IntermissionIn which I remind you that not all numbers are created equal, and there is a way to show that with symbols and stuff.
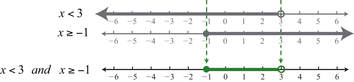
The ravenous math teacher's arm-mouth ever pursues the largest meal. This is also the charade to show that x>n is the same as n<x and it's not a huge deal which way you write it :) Guest List of the Continuous FiestaBecause the line on a continuous graph represents every possible point that line crosses, we need a way of inviting every single weird-decimal number that we want to include without individually naming them like we did for the discrete graph. That would literally take forever. Representing inequalities is the way to go. All the cool kids do it. Simply pretend the x or y axis is a number line, as shown above, wrap those numbers and little beaky symbols in curly brackets, pop a brownie in the microwave, and enjoy your success. If its one of those graphs where the ends are just arrows and you're like ????? how do I find the domain if the x values go on forever???? ? ?? NO PROBLEMO, just write D= {ALL REAL X}, meaning you have just advertised this party on every single social media you have including telephone poles and every x value who is a real number is invited. No limits!!! That wasn't a great explanation, so I'll leave it to my buddy Carlitos here to demonstrate some examples.
Hey everyone! Anastasia here. Sorry for the super late post! I'm hoping we didn't do lesson 2 on Friday so that at least my post will be in the right order. Anyhow, on Wednesday we started unit 5, relations & functions. The best part about this unit is that it is completely in worksheets and notes, which means you don't need to bring your text book to school! Your back will thank you! Now, getting into the lesson, we started with a review of the cartesian coordinate plane, which is just a fancy name for a graph, the kind you would plot coordinates [ie- (9,6)] on. We reviewed the x axis (horizontal); and the y axis (vertical); the origin, or "center" of the graph, where the x and y axes meet, (0,0); and the four quadrants that are labeled with roman numerals in counter clock-wise order, starting from the top right, I (+,+), II (-,+), III (-,-) and IV (+,-). *it was also mentioned that in science, we sometimes leave out the arrows on the negative side of the axes (both x and y) to show which side is positive. Next, we talked about relations. A relation in math is a comparison between two sets of numbers. Here are 7 ways a relationship between two quantities can be represented that we will consider in this unit. *pro tip: the last three are the most important! 1. in words 2. a table of values 3. a set of ordered pairs 4. a mapping/arrow diagram (not tested) 5. an equation 6. a graph 7. function notation Then, we talked about independent vs. dependent variables. Independent variables are variables that we control (ie- the left hand side of a table of values, the x axis of a graph, or the input of function notation). Dependent variables rely on the value of the independent variable (ie- the right hand side of a table of values, the y axis of a graph, or the output of function notation). Finally, we discussed discrete vs continuous graphs. Discrete graphs are graphs where a relation only exists for specific coordinates (and it isn't possible to have between values), and the points DON'T CONNECT. Continuous graphs are graphs where a relation exists at specific coordinates and ALL coordinates located between them. Points ARE CONNECTED with a line or a curve. (ex- data collected over a duration or a time would be displayed on a continuous graph) We also started on the homework for this lesson, on the worksheet, p392 #1, 2, 8, 9 and p406 #1, 2ac, 3acf, 4, 5, 6. I've attached some photos below explaining the things that were covered in this lesson; the cartesian coordinate system, independent vs dependent variables (a math-y and then a science-y example) and finally discrete vs continuous graphs. Hope this helps! Anastasia :)  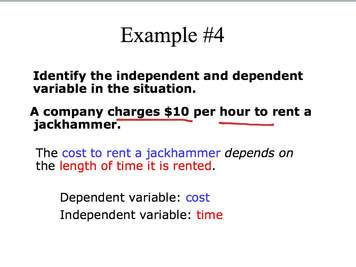 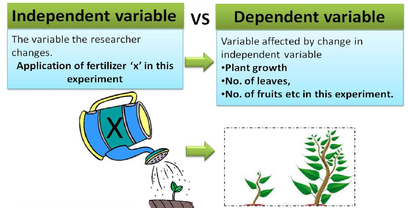 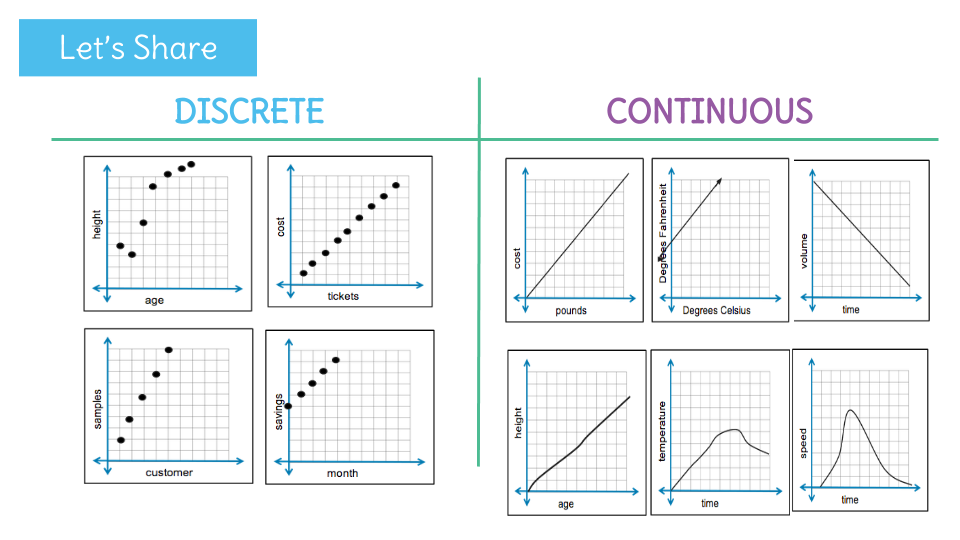 |
AuthorWe are the students of FPC Math 10C. Where are you from? Find your green dot!
Archives
June 2018
Categories |


 RSS Feed
