
|
Happy Tuesday everyone! I hope all of you had an awesome day in the sun! This Karmen with your linear equations blog post. We've been looking at 'slope-intercept form', aptly named considering it's form. This equation uses the slope and y-intercept to form any straight line on the graph (hence linear). Here's the form: y= mx + b It's super big because it's super important: this is the most commonly used line equation form. We'll need to know this, not only for our desmos projects, but also for higher level maths and sciences. As always, the m represents slope, while the b represents the y-intercept. Remember the slope equation (y-y divided by x-x) is also on your formula sheet, so no memorization! This (hopefully) is Josey's awesome post on line intercepts if you need a refresher. When plotting slope-intercept equations on a graph, you should start at the intercept and build the line, using its slope. 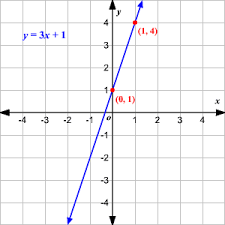 And we have a line! Whether you start with equation or graph, the concept it the same. So why? Why do we graph and stuff? It's to analyze data points, specifically (in this case) data that rises at steady increments. Naturally, the next step is word problems. I don't have any examples for those, but I'm sure if you asked Ms. Bjornson or a friendly young mathematician they'd be happy to help out. I've included videos below, as well as a little something extra.
(I just found the last one cool.)
0 Comments
Leave a Reply. |
AuthorWe are the students of FPC Math 10C. Where are you from? Find your green dot!
Archives
June 2018
Categories |
 RSS Feed
